Living the “Suite” Life

I had a LONG clinic yesterday afternoon–walked out the door at 6pm to make it to another meeting accross town, and left some things undone.

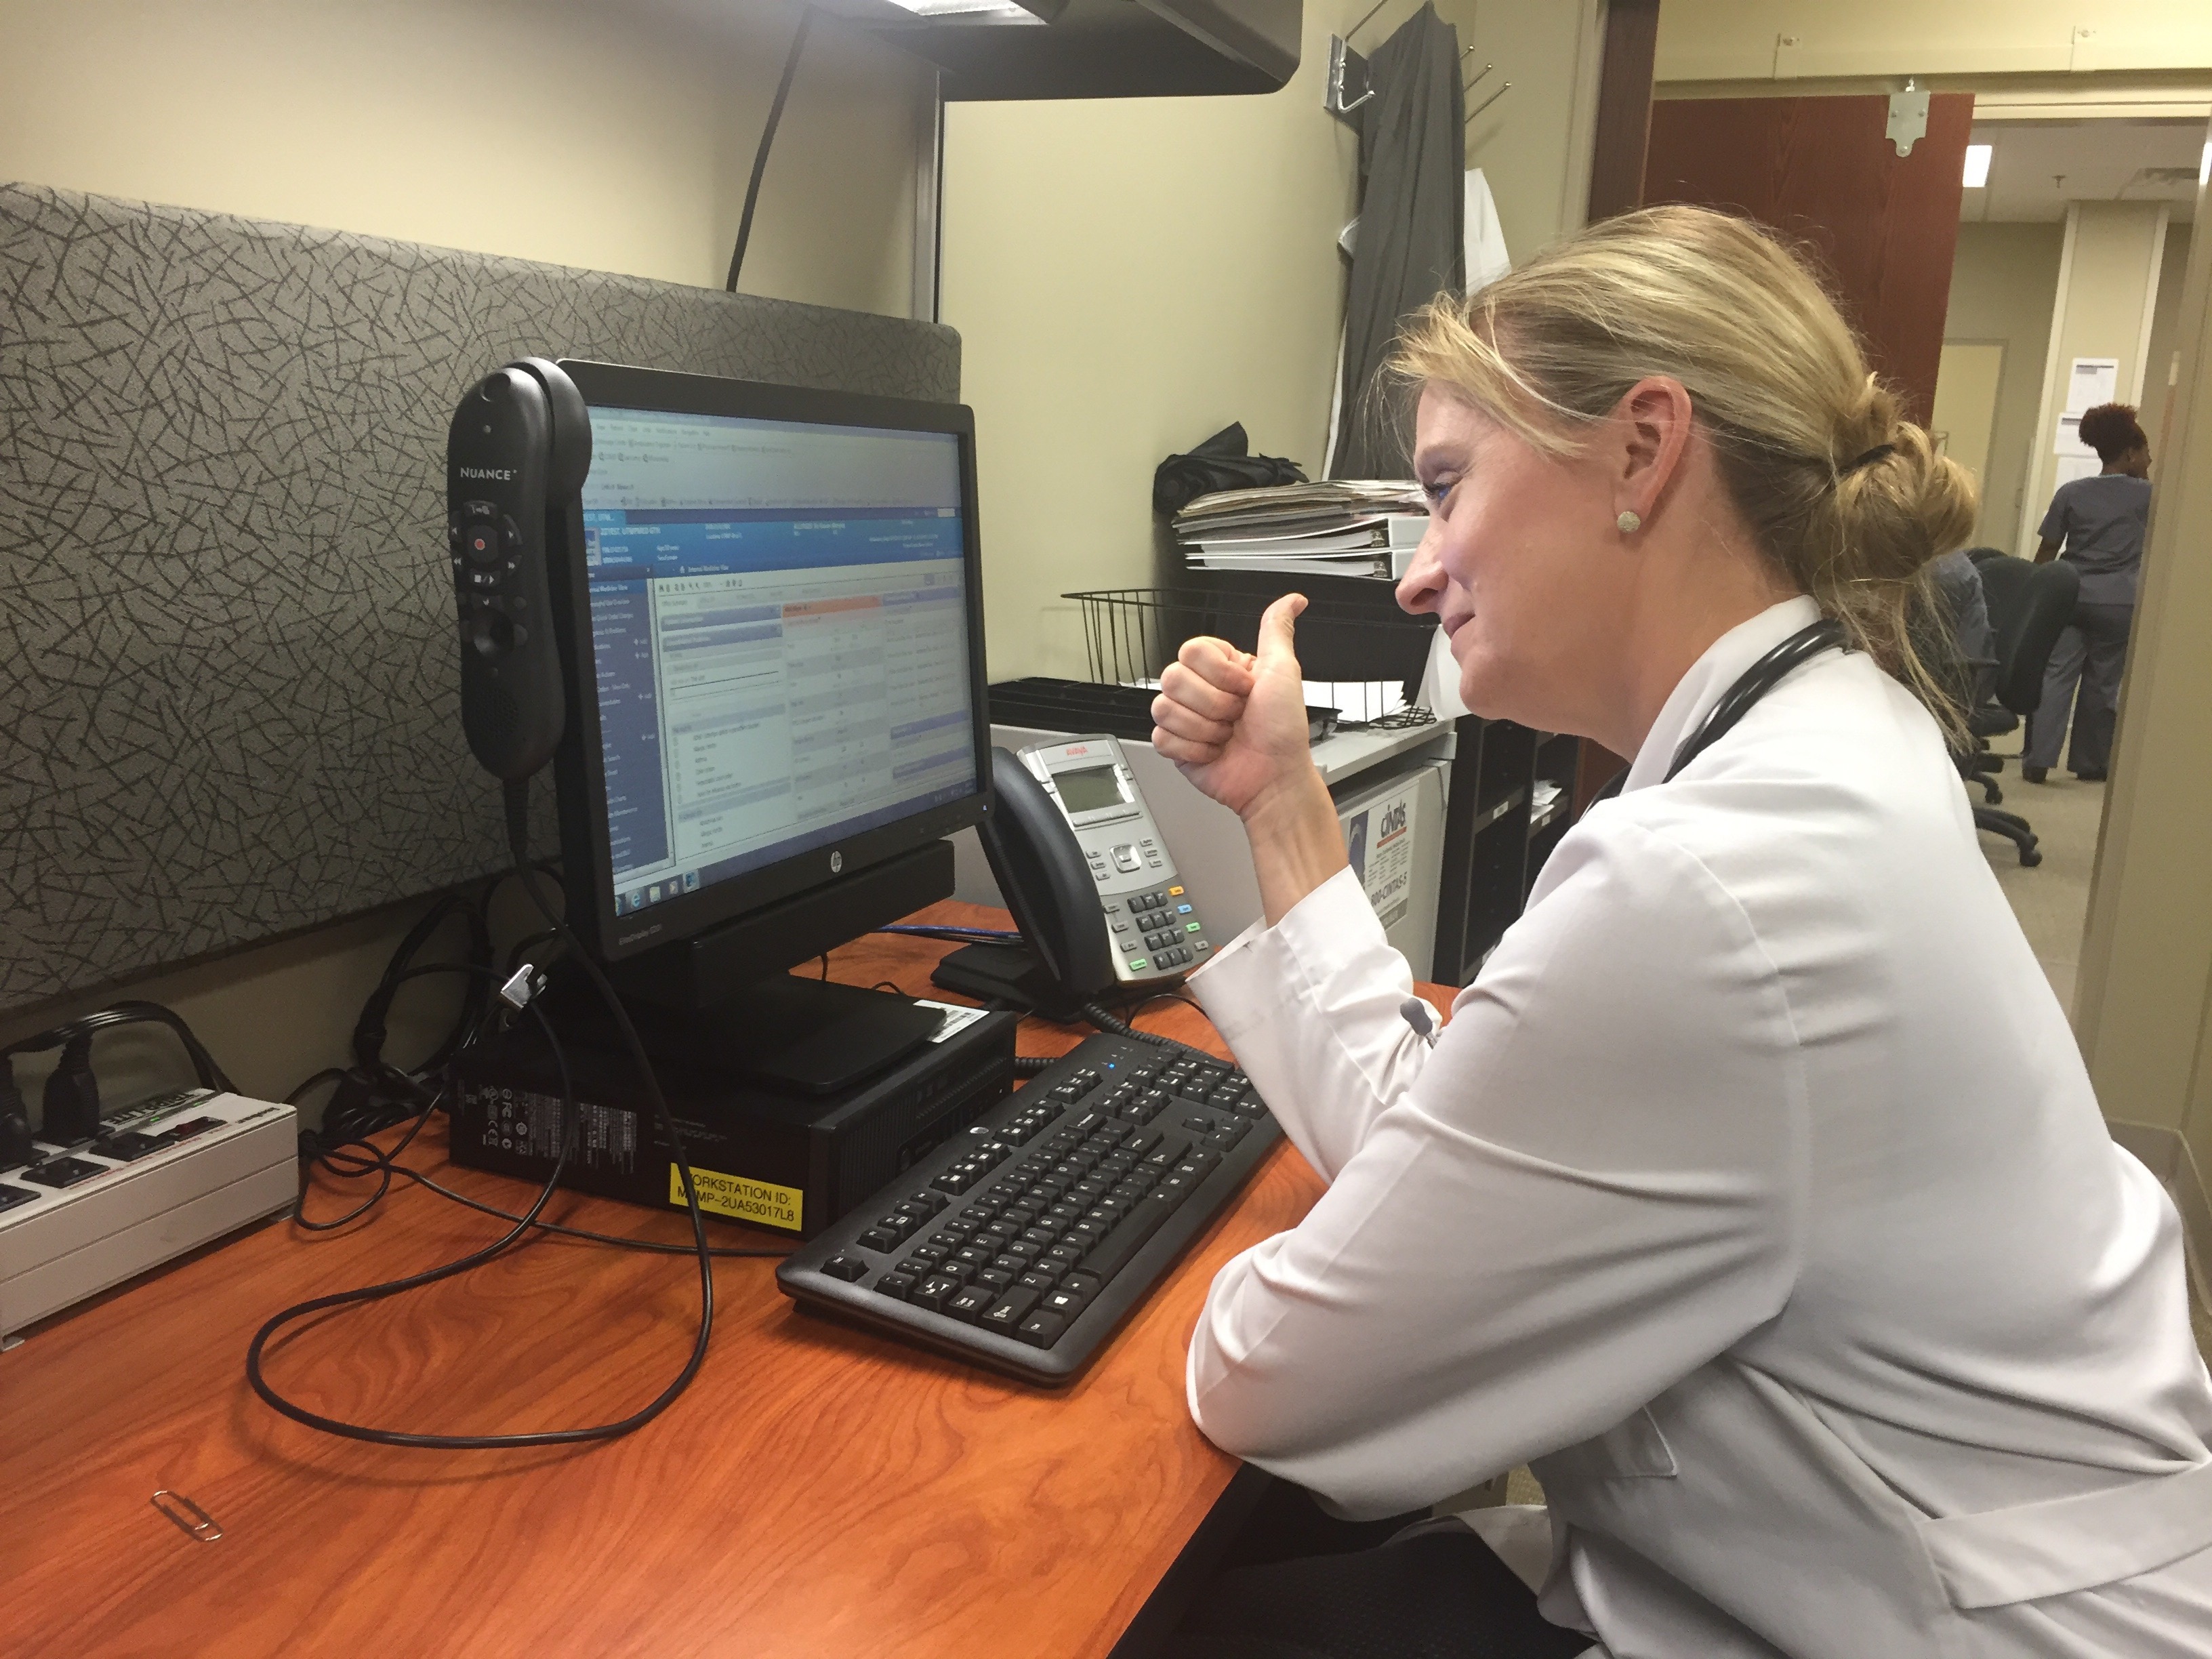
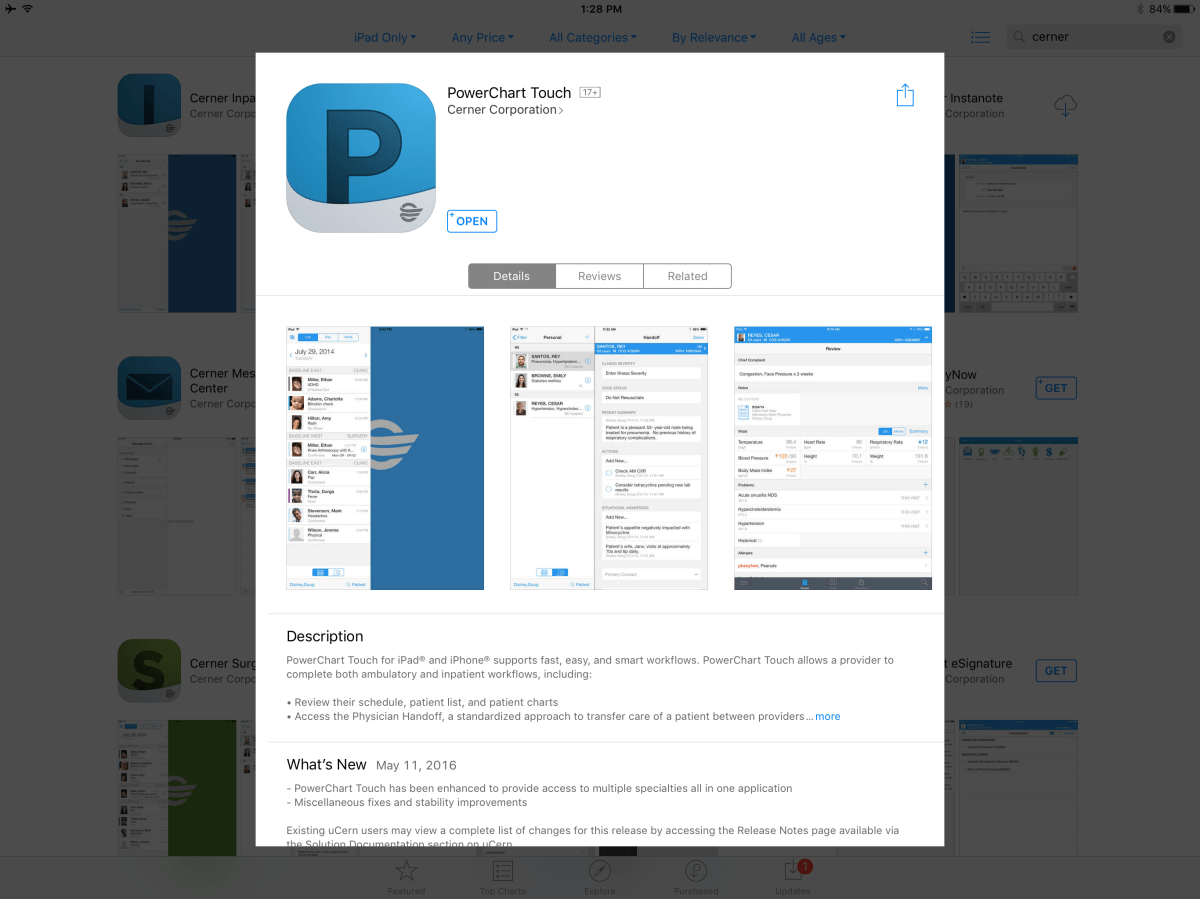
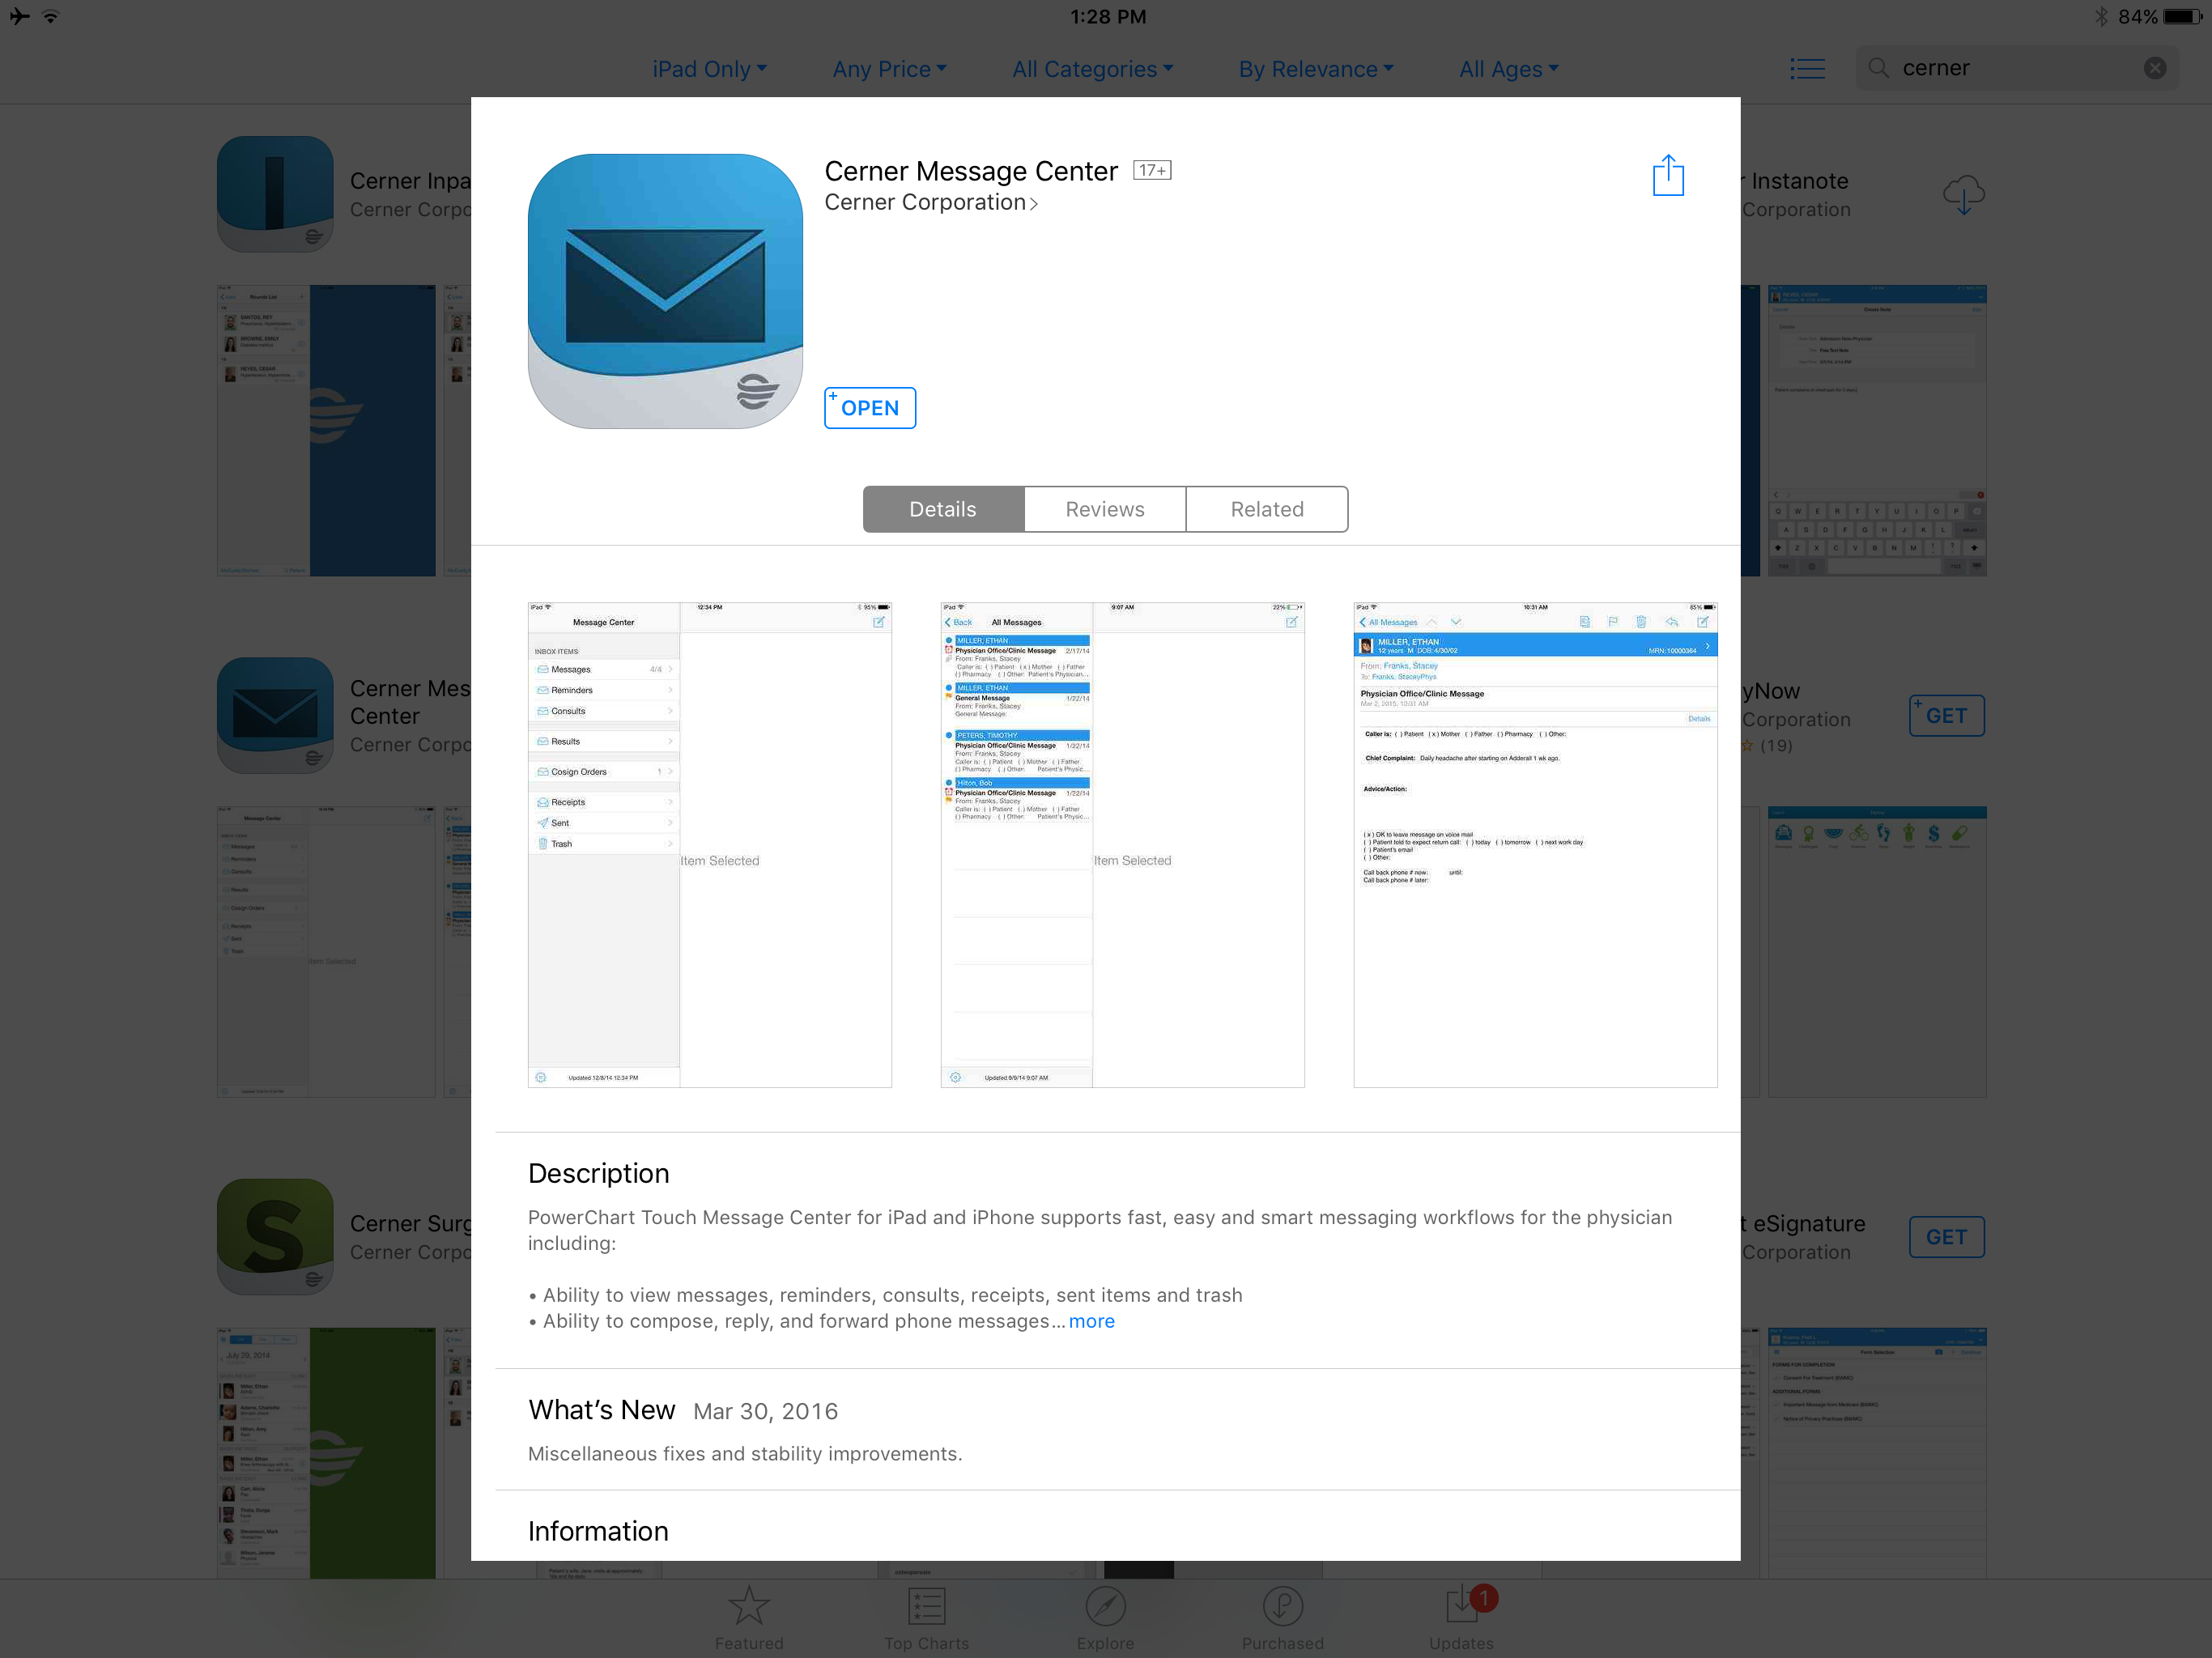
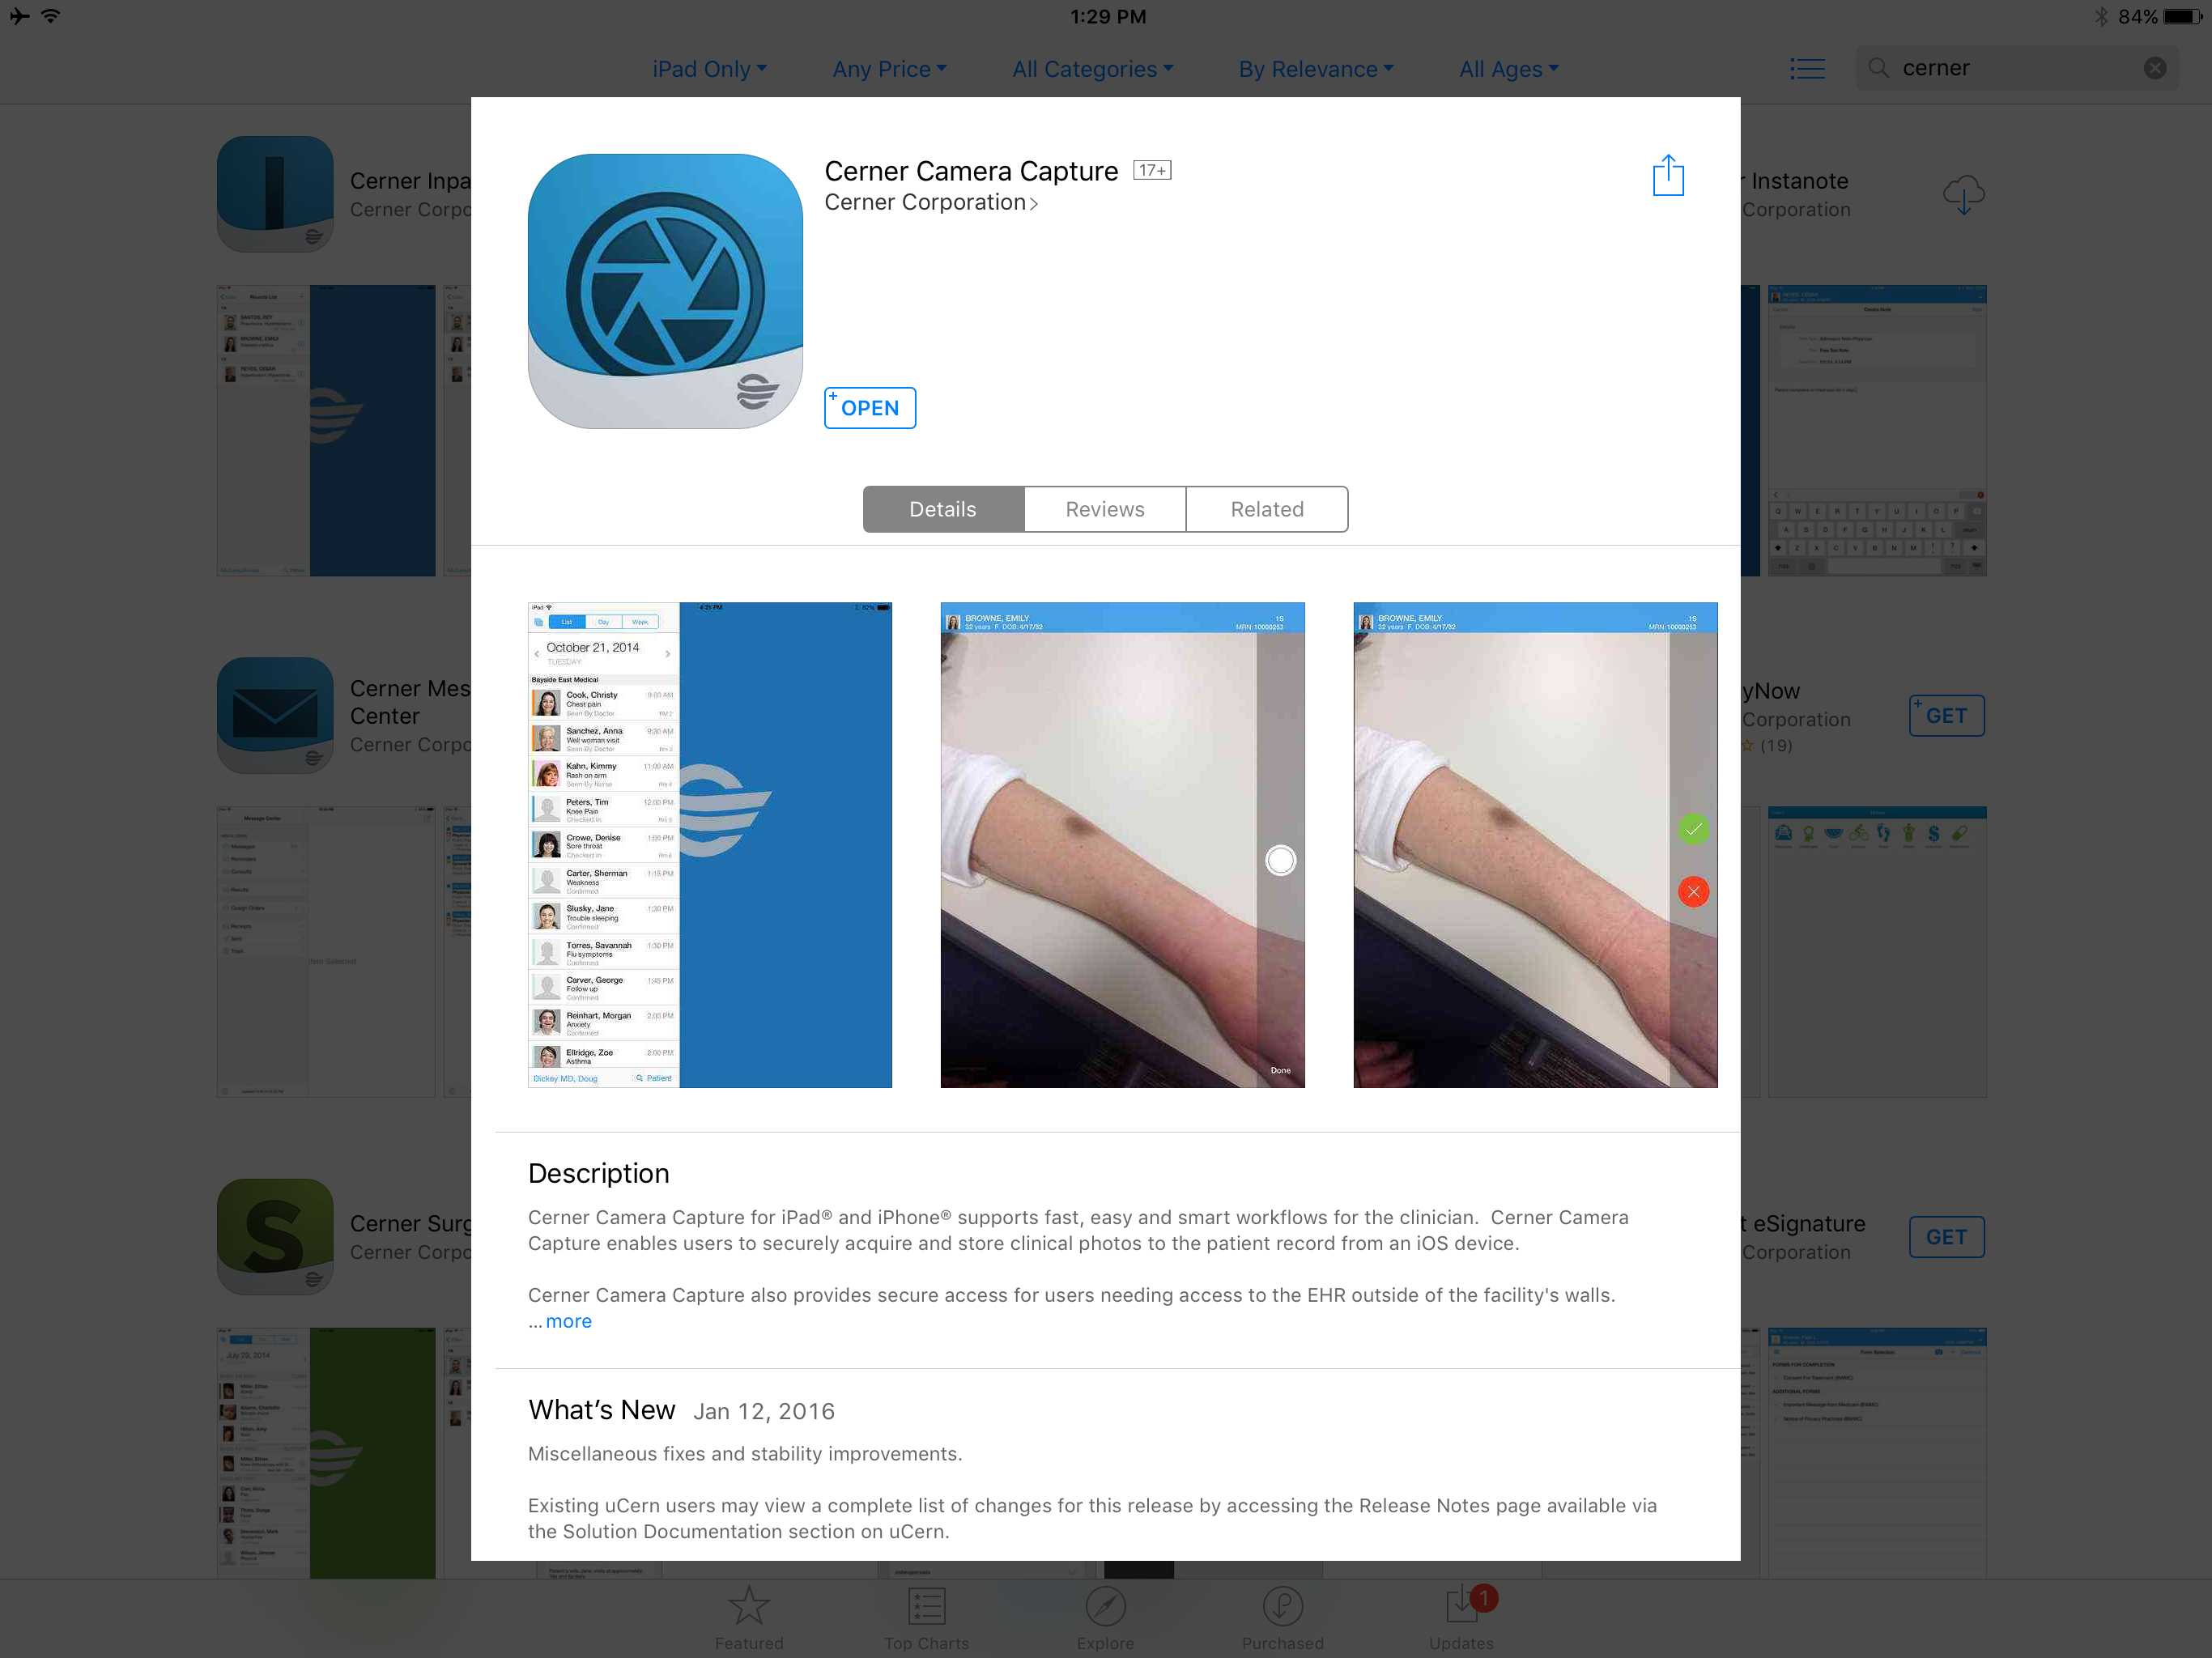
Today I’m on a long flight.  Thanks to the suite of Powerchart Touch apps (Powerchart Touch, Message Center, Camera Capture) once I hooked up to wifi, I was able to catch up on lab review, send results directly to patients via the Patient Portal, and finish my charts.  Yes, I needed to buy WiFi on the flight (I usually do anyway on long flights) and I have to tilt my iPad screen just a little to keep prying eyes away from patient information.   But still, this is pretty cool stuff, folks.  I would encourage to try the apps out.  Powerchart Touch is available for iOS in the AppStore.  You will need an access code to use it the first time.  You can obtain an access code via the Helpdesk (516-3111).  Message Center is available for iOS and coming soon to Android.  Camera Capture is available for both iOS and Android.  You only need to use the access code once.  Once your device is enrolled, you can use any of the Powerchart Touch apps.

This is a really bumpy flight, but charting was SMOOOTH!

Let’s get serious about the Patient Portal

One of the best ways to engage patients–to improve “care between the care” (office or hospital visits) –is to use the patient portal.  We have built a good foundation of useful content that patients can utilize:

                   -Lab results

                   -Radiology results

                  -Patient education

                  -Visit summaries from clinic visits and hospital stays

                 -Secure messaging to providers

                -Refill requests

                -Appointment requests

It has become my preferred way of communicating with patients.  It is SO easy to answer a quick question and to send their lab results to them, and patients LOVE it.

Some common myths:

  1.  My patients are poor and don’t have access.  Not true.  In the MLH system, the two facilities with the highest percentage of active portal use are Methodist North and Methodist South–22.4% and 18.7% respectively.  Methodist Germantown is at 7.4%. The difference between these facilities is that North and South are doing a better job of getting patients signed up.  I heard the Chief Medical Informatics Officer (CMIO) at Virgina Mason in Washington State say, “The best predictor we have found at getting patients on the portal is, ‘My doctor asked me to sign up'”.  I would like to see EVERYONE, from registration to nursing to providers, ask the patients to sign up.

  2.   My patients are old and don’t use the Internet.  The fastest growing group of users is SENIOR CITIZENS!  

Our colleagues at PCG are doing it better.  On average, PCG has about 30% of their patients using the portal, with some providers as high at 60%.

We have to continue to build our numbers to be successful.  In the not-too-distant future, we will have the capability to import patient-entered data–blood sugars, weights, blood pressures.  This will help us better manage patients with chronic disease, keeping them coming to clinic and not coming to the hospital.

What can you do?  Insist patients get signed up.  Ask your staff to insist patient sign up.  Once signed up, there are iOS and Andoid apps patients can use.  I promise, you won’t get buried in messages.  It’s really been no big deal.

Check out this link from Accenture about Patient Engagement


Accenture Survey about Patient Engagement

Telling the Patient Story Project

Before

We in Medical Informatics are constantly striving to improve the usuabilty and functionality of our EHRs.  As part of that process, we currently have  four worksreams focused on Telling the Patient Story.  

One of those worksreams includes Physician Optimization–improving clinicians understanding and adoption of the EHR, and improving the face-up look and feel of the physician workflow.

Using a background application called LightsOn, we can tell who is really struggling.  Our Physician Analysts (PAs) are tasked every week with identifying and working with those physicians who are struggling the most.  Don’t be offended if you get a visit from one of them.  Old dogs CAN learn new tricks.

The other major physician focus is Specialty Optimization.  We will be working through each major specialty with an identified Physician Champion to improve the documentation options for each specialty, improving QuickOrders on the Ambulatory venues, and building out the Workflow mPages for that specialty.  As a baseline, we are using Cerner Physician Playbooks which guide us on what content to deliver to an individual specialty and where to put so they can find it easily.Our colleagues at Emory have already done this quite successfully.  Check out the links below:

Reducing Pajama Time at Emory

You can live a better life! 

After
 

Coming in April 2016–Camera Capture

By the end of April 2016, we will be fully live with the Cerner Camera Capture application.  This allows clinicians using iOS (iPhone or iPad) (***BREAKING*** NOW AVAILABLE ON ANDROID!!)  to capture patient pictures in a HIPPA compliant way (the images are NOT saved to your device) and import them in to a chart document.  Currently, only Powernote allows for image imporatation–the functionality is expected for to be available for Dynamic Documentation later in 2016.

First, you need to request an access code from the Help Desk (516-3111).  Once you have the code, search for Cerner Camera Capture on the Apple App Store or the Google Play store and download it.  It’s free.

Next, launch the application and put in the access code when prompted to do so.  You only have to do this once.  

Then, select a patient using SEARCH, from your Ambulatory Schedule, or from the inpatient census. Once a patient is selected, the camera will come on and you can take a picture in pretty much the same way you’re used to.


Once you have taken the image, you need to pick a folder into which the image will live temporarily:

  
If you are done taking pictures, you now need to return to the desktop version of PowerChart.

If you are using a Powernote anyway, great!  If you are not, search for “Clinical Image Note:


Once you have the note open, look for the picture icon at the top of the note page:

  
This will launch the MultiMedia Manager, where you can choose the image you wish to import:


Once you choose the image(s) you want to import, hit INCLUDE, and you’re done.

You’ll now note that you see NOTHING!

Sorry about this next step, but you need to hit “Preview” to see what you have:
  
You can add free text nearby if you wish to further describe that you’re showing.  SIGN/SUBMIT and you’re done.

IMPORTANT:  You must import the image into a document to save it for the long-term.  Images in the MultiMedia Manager will be purged 7 days from original capture.

Your friendly Physican Analyst at your facility can help you if you have questions.  We hope you will find this useful to help tell the patient’s story.


Why functionality like Cerner’s Dynamic Documentation is Important

One of the major projects ongoing at Methodist LeBonheur Healthcare is “Telling the Patient Story”.  While discrete, structured data (sometimes referred to as “codified” data) are very important for clinical decision support functionality such at drug-drug interaction checking, allergy checking, and drug-disease interaction checking, there will always be a place, at least I hope, for a narrative of the patient’s story and a narrative of physicians’ thought processes in the electronic health record.  To meet the needs of “Big Data”, there is coming technology that allows the computer to interpret free text.  We at MLH will be moving more and more clinicians to Dynamic Documentation over the next 12-24 months.  I’ve used it since April of 2014, including in its infancy, and it is a major leap forward over ClinNote and Powernote, and will be the focus of future development of clinical documentation both at Cerner and at MLH.  Tap on the link below to read more about how digitizing is resulting in the loss of some of those intimate connections with have with patients and the connection we make in our clincal decision making.  

In summary, do we need structured data or narrative data?  The answer is “yes”.

As hospitals go digital, human stories get left behind.